Turn thousands of raw YouTube comments into a clean sentiment breakdown and a ranked list of what people are actually talking about.
Why I built this
YouTube comment sections are a goldmine of unfiltered audience opinion — and a nightmare to read manually.
If a video has 3,000 comments, no human is scrolling through all of them to figure out whether the reaction was positive, what themes keep coming up, or which words dominate the conversation.
So I built a small text-analytics tool that does it automatically. You give it a CSV of comments; it gives you back three things:
- Sentiment breakdown — what share of comments are positive, neutral, or negative
- Top keywords (TF-IDF) — the terms that matter most across the whole comment set
- Top nouns (POS tagging) — the concrete things people mention most often
It started as a university text-mining project, and I’ve since cleaned it up into something anyone can run!
What it actually does
1. Sentiment analysis
Every comment is scored on two dimensions:
- Score (−1.0 to +1.0): how positive or negative the comment is
- Magnitude (0 and up): how emotionally charged it is, regardless of direction
Comments are then labeled Positive / Neutral / Negative, and you get the overall percentage split — the single most useful number for “did people like this video?”
2. Keyword extraction (TF-IDF)
TF-IDF surfaces the words that are distinctive to your comment set, not just the most frequent. Common filler (“the”, “and”, “video”) gets filtered out; what’s left is the vocabulary that actually characterizes the conversation.
3. Noun extraction (POS tagging)
Using part-of-speech tagging, the tool isolates nouns — the concrete subjects of the discussion (products, names, places, features). This is often where the real insight hides: what are people talking about, not just how they feel.
Who it’s for
- Creators — checking how an upload actually landed
- Marketers — reading audience reaction to a campaign or launch
- Researchers & students — doing social-media text analysis
- Anyone curious — about what a comment section really thinks
Step-by-Step Guide: How to Collect & Analyze Data
- Export the comments you want to analyze as a CSV (one column of comment text is enough)
- Open the tool
- Upload the CSV in the tool
- Read your dashboard — sentiment split, keyword groups, and noun frequencies, all in one view
- Download the enriched results as a CSV for further analysis
Running an analysis takes only a few minutes. Follow this workflow to extract comments and view your dashboard:
Step 1: Install NCapture for Google Chrome
To extract high-quality comment data without dealing with complex API codes, we use NCapture, a powerful browser extension by NVivo
-
Open Google Chrome and go to the Chrome Web Store.
-
Search for NCapture (Capture for NVivo) and add the extension to your browser.
Step 2: Extract Comments via NCapture
-
Navigate to the specific YouTube video you want to analyze.
-
Click the NCapture extension icon in your top-right Chrome toolbar. If it didn’t appear on the toolbar, please click the puzzle piece icon and see whether NCapture is installed or not installed yet.
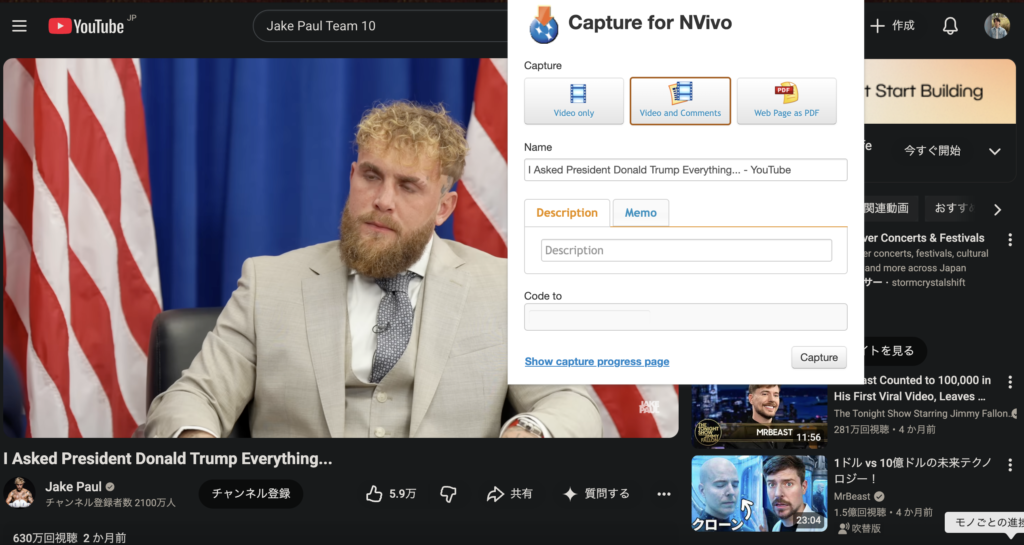
-
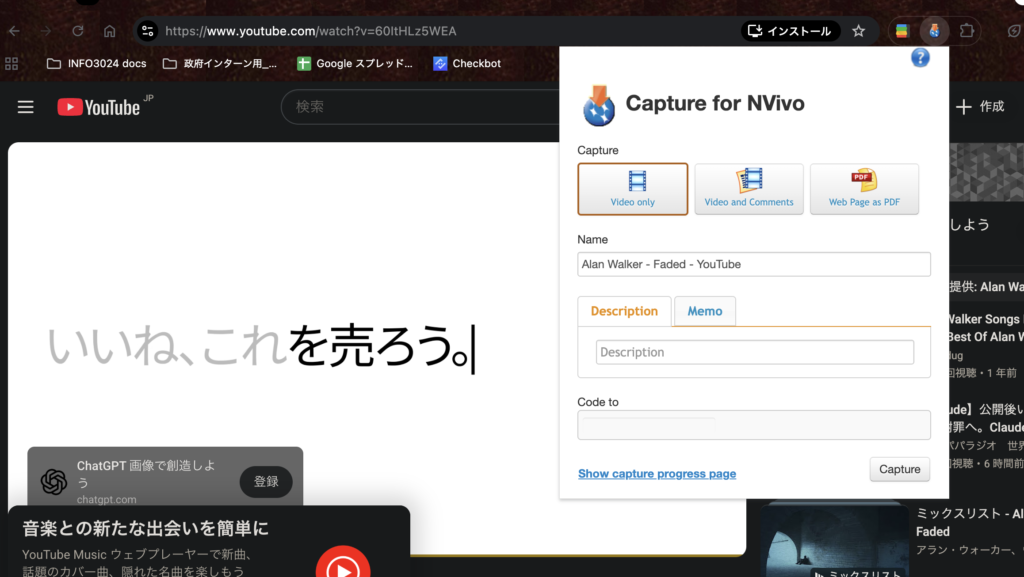
Select the “Video and Comments” option (as shown in the configuration interface below).
-
Click Capture button. A progress screen will track the download as it gathers the full comment catalog.
Quick Tip: Since downloading thousands of comments via browser extension can take a long time,
we highly recommend testing the tool first with a smaller video (e.g., a few hundred comments) to see how the dashboard works within minutes!
Step 3: Export Data to CSV
-
Once the capture is complete, you can open the data file (typically via NVivo or by converting the captured dataset straight into a spreadsheet structure)
-
Save or export the document as a standard file name_.csv file
Step 4: Run the Analytics Pipeline
To analyze your comments, we provide two flexible methods. For absolute beginners, Method A (Google Colab) is highly recommended as it runs 100% in your browser with zero terminal setup.
Method A: Run via Google Colab (Recommended / Web-Based)
Google Colab provides a pre-configured cloud environment. It is the most reliable way to execute the analysis without worrying about terminal commands or computer settings.
You can access the python code that I made for YouTube Comments Analytics
- Open the Workspace: Open our official template notebook on Google Colab (Link your Colab notebook here).
- Upload Your CSV File: Click the folder icon on the left sidebar in Google Colab, and drag & drop your generated comment CSV file there.
- Configure Your Credentials (Optional for Sentiment): If you want to unlock sentiment charts, paste your key into the
key = 'your_key_here'variable at the top of the script. - Execute: Go to the top menu, click Runtime ➔ Run all.
- Read Your Insights: The script will process your data. Within seconds, your custom sentiment summary tables, TF-IDF keyword rankings, and noun-frequency charts will render perfectly underneath the code cells. You can also download the enriched dataset from the left file sidebar.
Method B: Run via Streamlit Dashboard (Advanced / Local Machine)
If you prefer running a visual dashboard natively on your computer, you can run the tool from your Terminal using Python and Streamlit.
👉 Get the Python Script from here:youtube_analytics_app.py
What is this file?
Basically, you need a Python code that can categorise the top 20 nouns and key terms that were discussed in the YouTube comments. You can measure what they were discussing about your YouTube video, perhaps it can help you measuring audiences reaction briefly.
The downloaded file youtube_analytics_app.py is a standalone, lightweight Python script pre-configured as a complete web application.
It acts as a local dashboard engine that takes your exported CSV data and instantly coordinates the backend analytics pipeline (NLTK for text parsing and scikit-learn for mathematical modeling).
🔒 Enterprise-Grade Security Note:
This script runs 100% locally on your machine. Your audience data and comments are processed strictly within your own computer’s memory and are never uploaded to any external server (except for the secure, optional Google Cloud NLP API endpoint if sentiment analysis is turned on).
4-1. Open the Terminal
- On macOS, press Cmd + Space, type Terminal, and hit Enter.
- On Windows, open Command Prompt or PowerShell.
4-2. Install the required libraries (first time only)
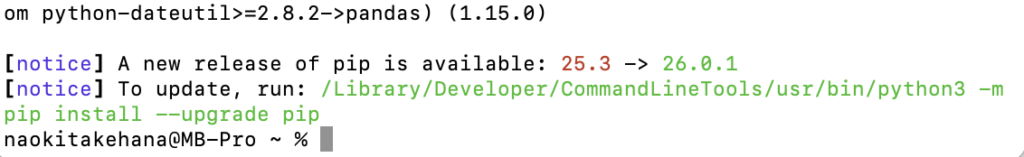
Copy and paste this command, then press Enter. It downloads everything the tool needs and takes a minute or two:
pip3 install streamlit pandas requests scikit-learn nltkWhen it finishes, you’ll see a list of installed packages ending in “Successfully installed…” — that means it worked.
4-3. Launch the dashboard
Now start the tool with the command below. Make sure your Terminal is in the folder where you saved the tool file (or replace the filename with its full path):
cd ~/Downloads
python3 -m streamlit run "youtube_analytics_app(1).py"
Your browser will open automatically athttp://localhost:8501
where your visual dashboard will appear.
💡 Pro Tips for Working with Terminal:
- Keep it Open: Leave the Terminal window open while using the tool — it serves as the background engine running the app.
- How to Stop: When you are finished with your analysis, go back to the Terminal and press Ctrl + C to safely shut down the app.
If it doesn’t, hold Cmd (or Ctrl on Windows) and click the Local URL shown in the Terminal. Leave the Terminal window open while you work — it’s the engine running the app.
To stop the tool later, return to the Terminal and press Ctrl + C.
4-4. Analyze your comments
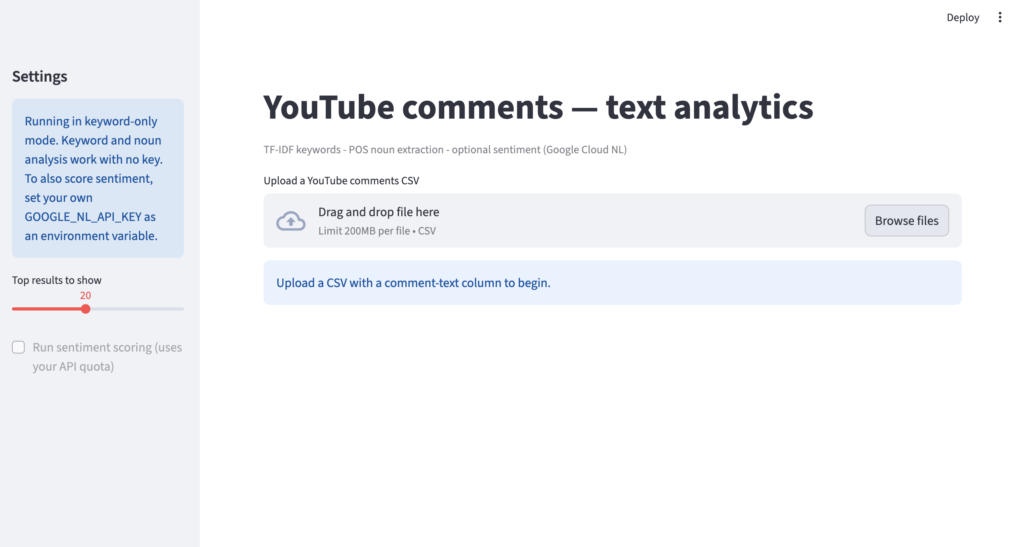
- Upload your CSV file into the local web interface “Browse files”.
- Select the text column that holds your comments — the tool auto-detects most standard formats, so usually this is already chosen for you.
- Read your dashboard. Your TF-IDF keyword rankings and noun-frequency charts render instantly in one unified view.
- Optional: Download the enriched dataset as a new CSV for your own reporting or deeper qualitative review.
Optional: Unlock sentiment analysis (For Both Methods)
The keyword and noun analysis runs completely free, with no setup. If you also want the sentiment percentage charts (positive / neutral / negative), you’ll need your own free Google Cloud Natural Language API key.
For Method B (Streamlit), set it once in your terminal before launching:
export GOOGLE_NL_API_KEY="your-own-key-here"Then run the launch command from step 4-3 as usual. If no key is set, the tool simply skips sentiment scoring and still gives you the full keyword and noun charts — nothing breaks.
How to get a Google Cloud Natural Language’s API key?
While the keyword and noun extraction features work completely free and locally out-of-the-box, unlocking the advanced Sentiment Analysis charts requires a Google Cloud Natural Language API Key.
Watch the short video below to see exactly how to enable the API on your Google Cloud Console and generate your secure key in less than 2 minutes: